How Did Negro League Teams Fare Against Major League Teams?
Modeling Winning Percentage
This section explores 2 different models for winning percentage. The first is a result of a slight change in the already established pythagorean formula. The second is a result of multiple regression.
Pythagorean Theorem
In 1980, statistician Bill James created a model that related a the total runs a team scores (RS) and the total runs they allow (RA) to their winning percentage (W%). The formula, called Pythagorean Percentage, is as follows:
W% = (RS^2) / (RS^2 + RA^2)
It has been found that 1.83 is the optimal exponent for years since 1920, while 2 can be used for more general purposes. Baseball Reference uses 1.83 as the exponent instead of 2.
But what is the optimal exponent to use for the Negro Leagues? To answer this question, I created a data set including every Negro League team that played a minimum of 60 games in the Negro Leagues in any single year between 1920 and 1948. There were 252 such teams. Three outliers were removed from the data set: The 1938 Memphis Red Sox, the 1946 New York Black Yankees and the 1948 New York Black Yankees. This left 249 teams in the data set. The data were collected from seamheads.com.
Click here to download the data set.
To calculate the number of runs scored and the runs allowed for each team, the average runs per game and runs allowed per game were multiplied by the total number of games the team played. This yielded a number very close to the true number of runs scored and runs allowed by the team. Due to the fact that the runs per game and runs allowed per game were rounded to one decimal in Seamheads, the totals are not exact. The totals were then plugged in to the above formula, adjusting the exponent each time.
To determine the most optimal exponent, the sum of squared residuals (SSR) was minimized. This was done by subtracting the formula's predicted winning percentage from the team's actual winning percentage, squaring that number, and summing the result over every team in the data set. The exponent that produced the lowest SSR was 1.95, which had an SSR of 0.32807.
Therefore, I would propose that the optimal exponent to use for applying Pythagorean Percentage to the Negro Leagues is 1.95. Raising the value of the exponent from 1.83 to 1.95 yields a wider range of winning percentages, as shown below:
Negro League teams played fewer intra-league games than other leagues. Major League teams played 154 games each season until 1961, when the American League began playing 162 games. (The National League switched to a 162 game schedule in 1962.) In contrast, the average number of games played per season by teams in the data set was 84.5. This results in a wider variability of winning percentages, as fewer games results in less opportunity for teams to tend towards the mean, which is a winning percentage of .500 for any given year. Using 1.95 in the pythagorean formula accounts for this higher variability in winning percentage.
Creating Another Model
Another model of winning percentage that I have found to be accurate is as follows:
W% = 0.39846 + 0.47136 * log(RS) - 0.45450 * log(RA)
The same data set as above was used. This is a linear model with two transformed predictor variables. While much less practical than the above formula, it is useful for precision. It has an R^2 value of 0.9155. To compare it with the Pythagorean formula, the SSR of this model was calculated and found to be 0.32135. This is slightly lower than the SSR of the Pythagorean formula with an exponent of 1.95. Both are precise ways of modeling winning percentage in the Negro Leagues.
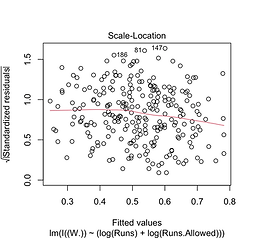
For those who are interested, the assumptions of the model are met. The residuals are normal, as shown by the normal probability plot below, for which the points fall very closely to the line. The kernel smoother is relatively flat on the scale-location plot, indicating that the variance of the error is constant. The residuals vs leverage plot shows that there are no high leverage points heavily influencing the line.
Demonstrating These Models
If you have not yet read the section titled "Negro Leagues vs Major Leagues", I recommend reading that before reading this paragraph. In that section, we saw that the Negro Leagues outscored the Major Leagues 532 to 497 across the 126 interleague games from 1920 to 1948 that seamheads.com recorded. The Negro Leagues had a 63-61-2 record across those games, resulting in a .508 winning percentage. Let's see what the models say. Plugging the numbers in to the pythagorean formula, we get:
(532^1.95) / (532^1.95+497^1.95) = .533
This suggests that the Negro Leagues teams actually played better than a .508 winning percentage. A .533 winning percentage roughly converts to a 67-59 expected record over 126 games.
For the linear model, we can create a prediction interval. A 95% prediction interval for a team that scores 532 runs and allows 497 is the following: (0.453, 0.617). The center of the interval, which is also the fitted value, is .535. The Negro Leagues actual winning percentage of .508 falls in this interval. So while both models predict that the Negro Leagues would have a better winning percentage than .508 against Major League teams, .508 is a reasonable winning percentage for the Negro Leagues to have achieved based on the number of runs they scored and allowed.
We'll look at some specific clubs as well. Let's start with the 1923 Hilldale Club. Based in Pennsylvania, they went 40-21-1 in 1923, primarily playing in the Eastern Colored League. This was good for a .656 winning percentage. Both models achieve a very similar output. The pythagorean formula yields a winning percentage of .662, while the linear model outputs a winning percentage of .657. The models are very accurate for Hilldale in 1923.
Now, let's look at a club for which the models perform worse. We'll look at the 1935 Philadelphia Stars, who went 35-31-4, yielding a .530 winning percentage. They played primarily in the Negro National League II. Despite finishing above .500, the Stars were outscored approximately 427 to 378 by my calculation. Thus, the pythagorean formula returned a .442 winning percentage, while the linear model returned a .443 winning percentage. The models were not accurate for the Stars in 1935, but it can also be said that the Stars' record was not an accurate reflection of their performance in 1935.
The models perform very similarly to each other. However, there are some teams for which one model performs better than the other. Take the 1943 Homestead Grays for example. They were a dominant team, winning the Negro National League II with a 26-7-1 record. Their overall regular season record was 78-23-1. After beating the Birmingham Black Barons in the Negro League World Series, the Grays had a total record of 82-26-2, good for a .759 winning percentage. The pythagorean formula nearly yields the Grays winning percentage exactly, outputting .757. However, the linear model misses the mark by a much wider margin, resulting in a .780 predicted winning percentage.